
티스토리 뷰
이 코드는 Python에서 시계열 데이터를 분석하는 데 사용되는 라이브러리들을 활용하여 주식 가격 데이터의 안정성을 분석하는 예제입니다.
우선, numpy, pandas, matplotlib.pyplot, numpy.ma.core, statsmodels.tsa.stattools 모듈을 불러옵니다.
import numpy as np
import pandas as pd
import matplotlib.pyplot as plt
from numpy.ma.core import size
from statsmodels.tsa.stattools import adfuller
이어서, matplotlib.pyplot을 사용하여 시계열 데이터를 그래프로 그립니다.
plt.plot(series)
plt.title("Close price of google")
plt.show()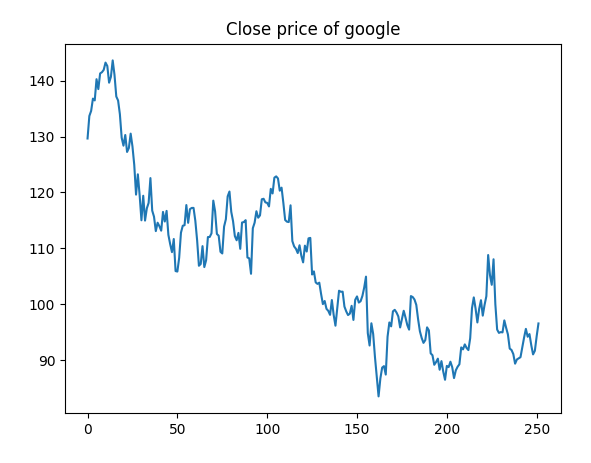
그림을 보면, 시간에 따른 구글 주가의 종가를 나타내는 것을 확인할 수 있습니다.
이제, adfuller 함수를 사용하여 시계열 데이터의 안정성(stationarity)을 검정합니다. adfuller 함수는 Augmented Dickey-Fuller 검정을 수행하며, 이 검정은 주어진 시계열 데이터가 안정적인지 아닌지를 판단하는 데 사용됩니다. 검정 결과는 ADF statistics, p-value, 그리고 critical values 등이 포함되어 있습니다.
귀무가설: 시계열이 unit root를 포함하고 있다.
unit root를 포함하고 있는 경우 시계열은 non-stationary 합니다. 반대로 귀무가설을 기각하는 경우는
stantionary 한 시계열을 보장할 수 있습니다.
result = adfuller(series)

print(f'ADF statistics : {result[0]}')
print(f'p-value {result[1]}')
print('critical values: ')
for key, value in result[4].items():
    print(f"\t{key} {value}")
출력된 결과는 다음과 같습니다.
ADF statistics : -2.665032427258732
p-value 0.07962954562193602
critical values:
	1% -3.436865840829037
	5% -2.8641974895429993
	10% -2.568758990135295
ADF statistics는 검정 통계량으로, 검정 결과가 음수일수록 시계열 데이터가 안정적이라는 것을 의미합니다. p-value는 귀무가설이 맞을 확률을 나타내며, 이 값이 0.05보다 작으면 귀무가설을 기각하고, 시계열 데이터가 안정적이라는 결론을 내릴 수 있습니다. 반대로, 이 값이 0.05보다 크면 귀무가설을 기각하지 못하고, 시계열 데이터가 안정적이 아니라 불안정(non-stationary) 하다고 판단하여 분석에 주의하여야 합니다. 그리고, 검정 결과에 따라 시계열 데이터가 안정적인지 아닌지를 판단합니다.
if result[1] < 0.05:
    print("reject the null hypothesis - the time series doesn't have unit root, i.e it is stationary")
else:
    print("fail to reject the null hypothesis - i.e it is non-stationary")
fail to reject the null hypothesis - i.e it is non-stationary
p-value가 0.05보다 작으면 "reject the null hypothesis - the time series doesn't have unit root, i.e it is stationary"라는 메시지가 출력되며, 이는 시계열 데이터가 안정적이라는 것을 의미합니다. 반대로, p-value가 0.05보다 크면 "fail to reject the null hypothesis - i.e it is non-stationary"라는 메시지가 출력되며, 이는 시계열 데이터가 안정적이 아니라는 것을 의미합니다.
본 예시와 같은 구글 가격과 같은 시계열은 대부분 non-stationary하므로 분석에 유의하여야합니다.
'머신러닝 파이썬' 카테고리의 다른 글
| 선형 회귀를 이용한 시계열 예측의 한계와 대안적인 방법(python) (0) | 2023.03.17 |
|---|---|
| 시계열 데이터 분석: Pandas를 이용한 자기상관 플롯(Autocorrelation Plot) (0) | 2023.03.17 |
| python에서 dropna() 또는 fillna() 를 이용한 결측치 메우기 (0) | 2023.03.14 |
| 계층적 군집화로 iris 데이터 분석하기(병합적 군집화) (0) | 2023.03.07 |
| DBSCAN을 사용하여 데이터셋을 클러스터링하는 방법 (0) | 2023.03.07 |